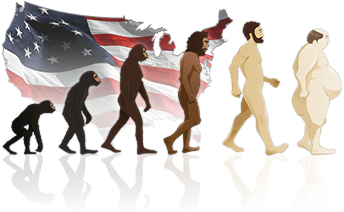


About Obesity
An obese person has accumulated so much body fat that it might have a negative effect on their health. If a person's bodyweight is at least 20% higher than it should be, he or she is considered obese. If your Body Mass Index (BMI) is between 25 and 29.9 you are considered overweight. If your BMI is 30 or over you are considered obese.
Source: http://www.medicalnewstoday.com/info/obesity/
Our visualization uses the CDC's data from 1985 to 2010 decribing the percentage of the U.S. population with a BMI greator than or equal to 30 as our obesity rates.
Obesity is an Epidemic!
Obesity in America is a major public health crisis. As of 2010 nearly 30% of the population was Obease. Today that number is even higher. High obesity rates increase obesity related disease. These diseases are typically chronic and require expensive treatments over many years. Beyond the costs there is no question: Americans living with these diseases suffer. Amputations, blindness, mobility constraints, medication difficulties (cost, side-effects, etc.) are a small list of some of the ways quality of life is diminished for Americans suffering with obesity related disease. Furthermore, the treatment costs for these diseases is typically beyond the ability of the afflicted to pay, and these costs become the burden of the public.
So why, in the age of information, are Americans as a population still continuing to exhibit historically record high obesity rates?Why is obesity still an increasing phenomenon across all age groups, all States, and all income levels?
A brief study of the problem reveals there is no silver bullet answer to these questions. Factors contributing to obesity are numerous, dynamic, and pervasive. Indeed, with much focus and research we may determine some factors, but we by no means claim to account for all factors. Here are the factors (variables) we've discovered through research which show potential correlation as contributing factors to the phenomenon of chronic obesity in America:
About Our Research
Our data analysis aims to illustrate how obesity is a multi-faceted phenomenon and each variable in and of itself is not a definitive factor explaining the recent trends in obesity, however, these factors, acting in concert on society, does indeed have a demonstrable effect. This analysis intends on demonstrating what the extent of that collective effect is and to what extent each of our recognized variables contributes to the phenomena.
This analysis will not include semantic ranges within our data (age, sex, ethnic group, etc.) rather we will treat the population (United States) as a whole. The primary reason for this choice is the scope of this project and built in time constraints.
We are aware there are additional variables which correlate with obesity either positively or negatively which are valid metrics, such as socioeconomic status, and are not included within the scope of this project. There are undoubtedly numerous other variables which remain largely unknown and this project makes no attempt to deduce to what extent the unknown factors influence the overall obesity trends. We simply aim to discover if our hypothesized factors do indeed play a role in the U.S. obesity rate.
View our Data Sources
Download the Dataset
Our Conclusions
Through our research, we came to realize that many of the factors we studied, such as the decrease in Manual Labor over the years, and the increase in the availability of Kilo Calories per Capita does, indeed, play a role in the increase of obesity among U.S. citizens. We have used a statistical analysis to determine the percentage of likelihood that each of the factors we studied effects obesity rates.
Click the button above to view our visualization and discover how we came to our conclusions.
Data Sources:
- http://apps.nccd.cdc.gov/brfss/
- http://www.cdc.gov/obesity/downloads/obesity_trends_2010.ppt
- http://www.cnpp.usda.gov/tools/IFS/NFSdatabase/QueNut.asp
- http://www.who.int/mediacentre/factsheets/fs311/en/
- http://www.multpl.com/united-states-population/table
- http://www.infoplease.com/ipa/A0933563.html
- http://www.bls.gov/
